The Ultimate Guide to Bearish Harami Cross Candlestick Patterns
Last updated: January 12, 2025
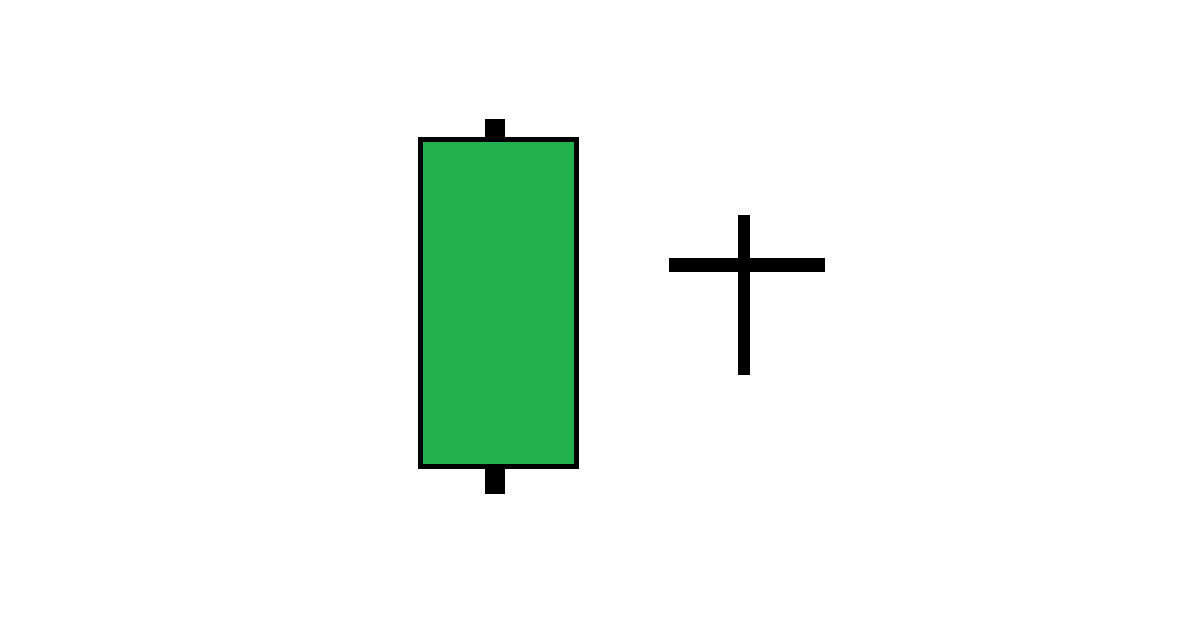
Bearish Harami Cross Pattern
In this pattern, a doji candle body falls within the extended body of the preceding candle, indicating that the strongly bullish market movements seens the previous day are running out of steam:
The bearish harami cross pattern is identical to the bearish harami, except the second candle is a doji.
General Identification & Interpretation
Steve Nison is credited with bringing Japanese candlestick charting to the West. In his book "Japanese Candlestick Charting Techniques" he describes bearish harami cross patterns with the following characteristics:
Typical characteristics
First candlestick is an unusually long green candle
Second candlestick is a doji (or a small real body approaching a doji)
The candles don't necessarily have to be opposing colors
Examples of use as a trading indicator
Potential bearish reversal signal after an uptrend
The smaller the real body of the second candle, the stronger the potential reversal signal from this pattern
Other interpretations
If the second candle is not a doji (or subjectively close to it) but has a small real body within the body of the first candle, this pattern is classified as simply a harami.
More for beginners
Check out our quick start guide to candlestick charting for more information if you are new to candlestick charting!