The Ultimate Guide to Bullish Counterattack Lines Candlestick Patterns
Last updated: January 12, 2025
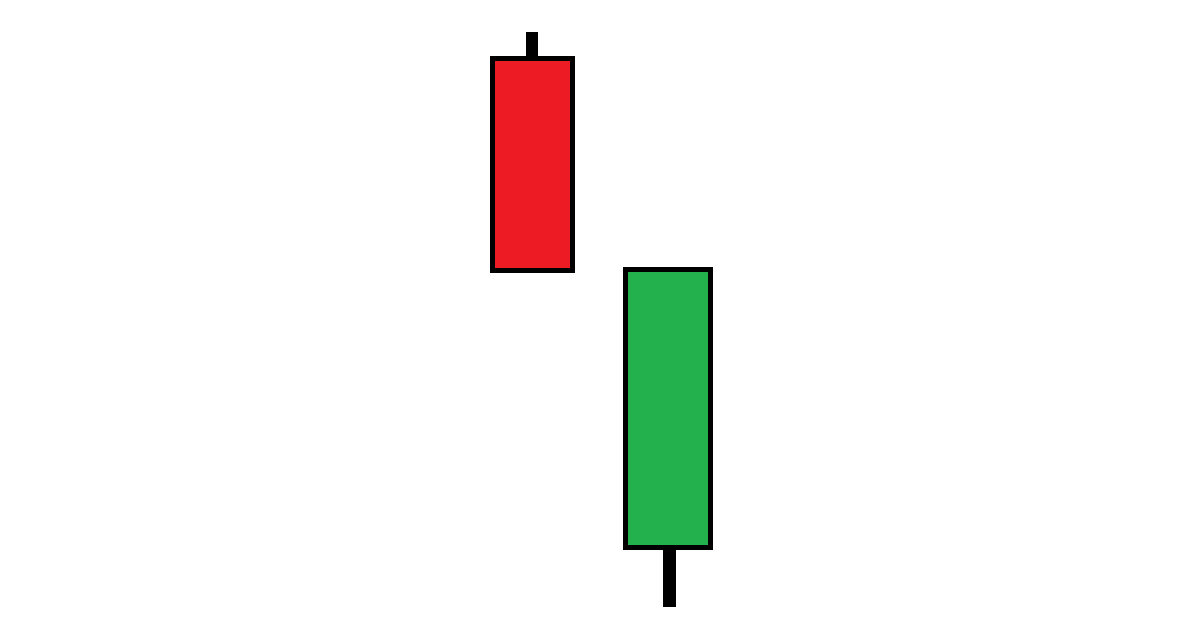
Bullish Counterattack Lines Pattern
Counterattack line candlestick patterns occur when two sequential candles are opposite in color and have the same closing price.
After a decline in price, the next session opens lower but rallys in price back to the close of the previous session
General Identification & Interpretation
Steve Nison is credited with bringing Japanese candlestick charting to the West. In his book "Japanese Candlestick Charting Techniques" he describes bullish counterattack lines patterns with the following characteristics:
Typical characteristics
Two sequential candles with two opposing colors, with the close of the second candle nearing the close of the first candle
The first candle in the pattern typically has a large real body. The first candle is red (closes lower than it opens), which is followed by a second candle that is green (closes higher than it opens)
the bullish counterattack line pattern typically occurs after a price decline
Examples of use as a trading indicator
Potential reversal signal after significant market movements, showing the opposing force (bulls vs bears) has managed to take control of the price
Other interpretations
The bullish counterattack line pattern is similar to the piercing pattern, except the second candle closes near the previous session's close, not substantially within the previous session's body.
More for beginners
Check out our quick start guide to candlestick charting for more information if you are new to candlestick charting!