The Ultimate Guide to Bullish Harami Cross Candlestick Patterns
Last updated: January 12, 2025
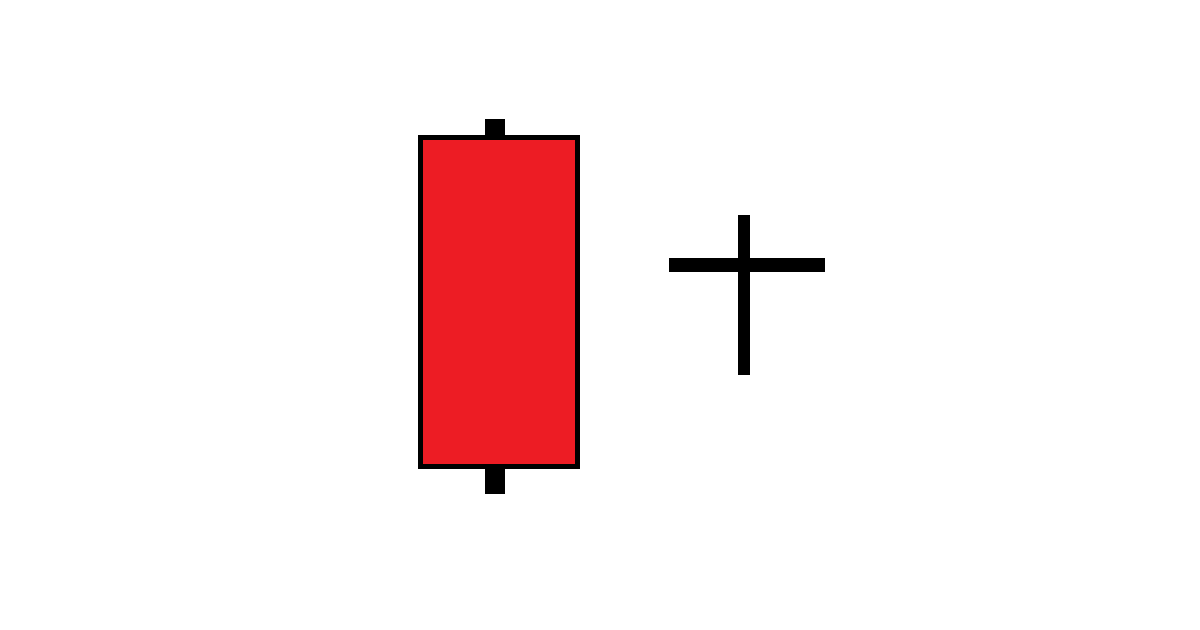
Bullish Harami Cross Pattern
The bullish harami cross candlestick pattern is identical to the bullish harami pattern, except the second candle is a doji:
In this pattern, a doji candlestick body falls within the extended body of the preceding candle, indicating that the strongly bearish market movements seen the previous day are running out of steam.
General Identification & Interpretation
Steve Nison is credited with bringing Japanese candlestick charting to the West. In his book "Japanese Candlestick Charting Techniques" he describes bullish harami cross patterns with the following characteristics:
Typical characteristics
First candlestick is an unusually long red candle
Second candlestick is a doji (or a small real body approaching a doji)
The candles don't necessarily have to be opposing colors
Examples of use as a trading indicator
Potential bullish reversal signal after a downtrend
The smaller the real body of the second candle, the stronger the potential reversal signal from this pattern
Other interpretations
If the second candle is not a doji (or subjectively close to it) but has a small real body within the body of the first candle, this pattern is classified as simply a harami.
More for beginners
Check out our quick start guide to candlestick charting for more information if you are new to candlestick charting!