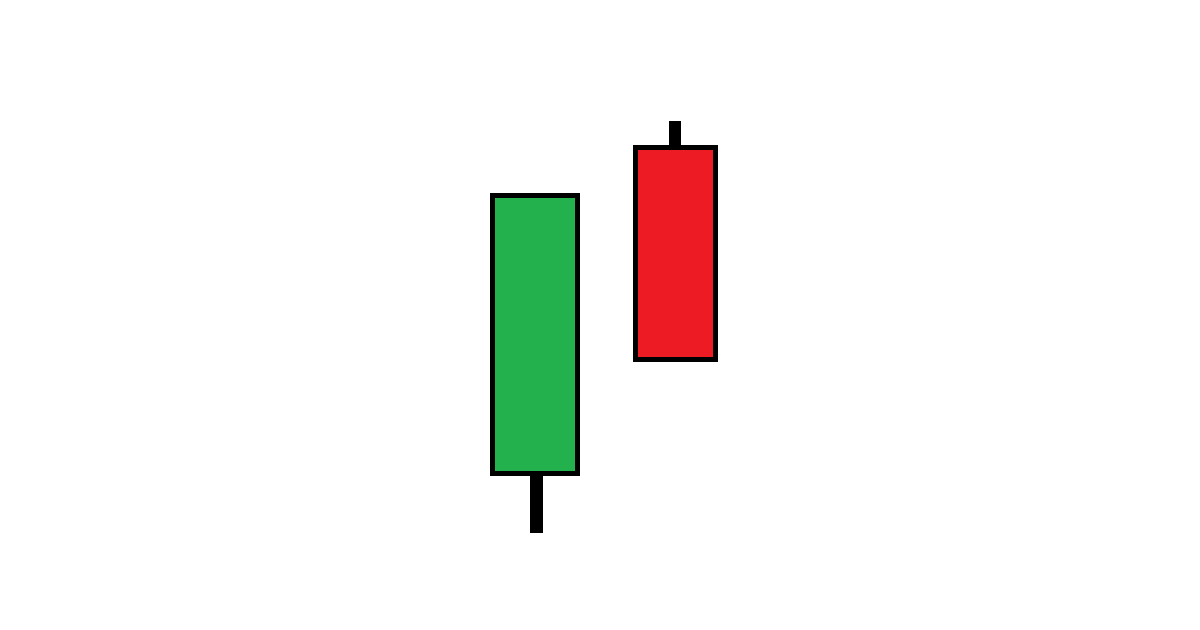
The dark cloud cover candlestick pattern can signal a bearish reversal. Two candles are needed to form this pattern - after a strong bullish candle, the stock opens even higher the next day, but the bears ultimately push the price back down into the body of the previous day:
This pattern shows that the bulls are in initial control of the market (as shown by the strong bullish candle on the first day, opening gap up the following day) but lose control to the bears during the second day as the price falls to within the body of the first day.
General Identification & Interpretation
Steve Nison is credited with bringing Japanese candlestick charting to the West. In his book "Japanese Candlestick Charting Techniques" he describes dark cloud cover patterns with the following characteristics:
Typical characteristics
First candlestick is a strong green candle
Although the second candlestick opens higher, the price falls and penetrates into the body of the first candle (ideally by 50% or more)
Examples of use as a trading indicator
Potential bearish reversal signal after an uptrend
Resistance level near the highs of the dark cloud cover pattern
More for beginners
Check out our quick start guide to candlestick charting for more information if you are new to candlestick charting!