The Ultimate Guide to Downgap Side-by-Side White Lines Candlestick Patterns
Last updated: February 7, 2024
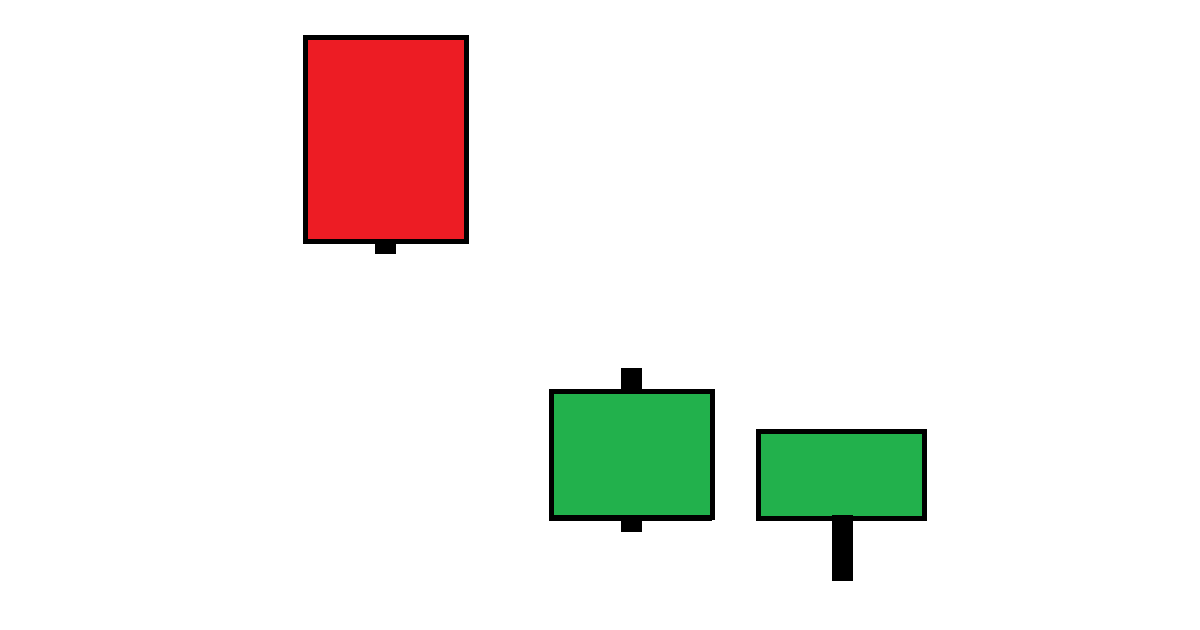
Downgap Side-by-Side White Lines Pattern
The downgap side-by-side white lines pattern occurs when two candles, which are both green, similar in size, and with similar opening prices, occur after a falling window:
General Identification & Interpretation
Steve Nison is credited with bringing Japanese candlestick charting to the West. In his book "Japanese Candlestick Charting Techniques" he describes downgap side-by-side white lines patterns with the following characteristics:
Typical characteristics
A falling window forms, with two subsequent green candles occurring below the bottom of the window, both similar in size and opening
Examples of use as a trading indicator
Resistance levels can be found within the falling window that forms, which is voided after a close above the window
Throughout a price decline, the occurrence of this pattern indicates that the present trend (bearish) is continuing
More for beginners
Check out our quick start guide to candlestick charting for more information if you are new to candlestick charting!