The Ultimate Guide to Downward Gapping Tasuki Candlestick Patterns
Last updated: January 12, 2025
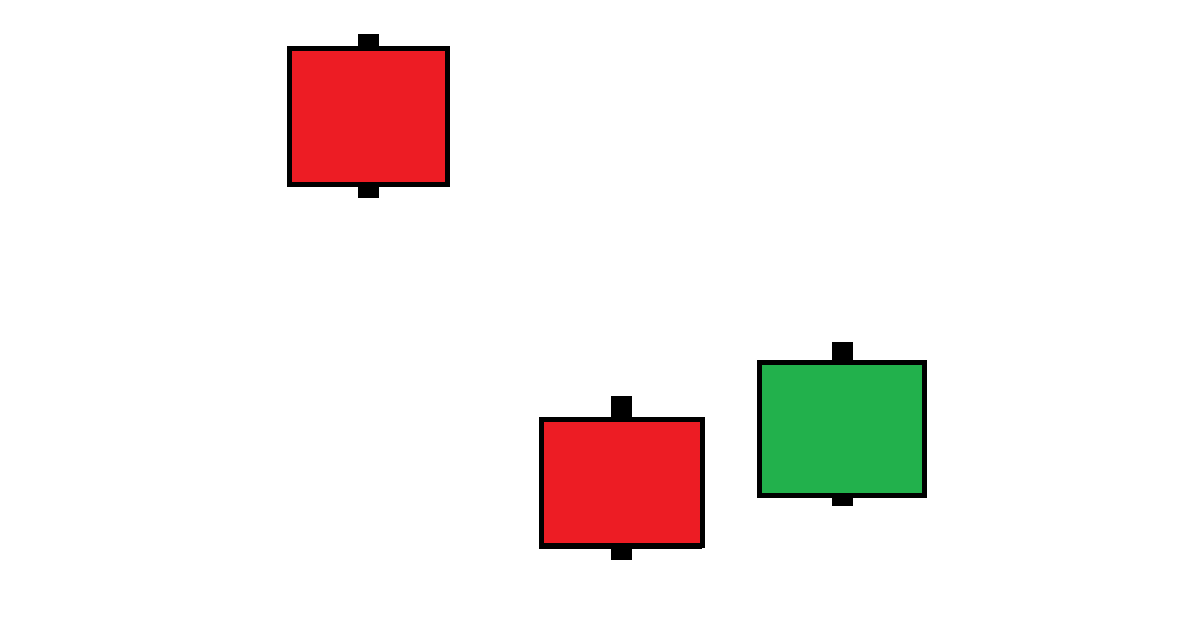
Downward Gapping Tasuki Pattern
The downward gapping tasuki candlestick pattern is composed of a pair of candles which occur after a falling window:
The two candles after the window are similar in size - the first candle is bearish (red), closing lower than it opened, and the second candle is bullish (green), closing higher than it opened (opening within the first candle's body and closing above it).
General Identification & Interpretation
Steve Nison is credited with bringing Japanese candlestick charting to the West. In his book "Japanese Candlestick Charting Techniques" he describes downward gapping tasuki patterns with the following characteristics:
Typical characteristics
Two consecutive candles, similar in size, occurring after a falling window
The first candle is red (closing lower than it opened)
The second candle is green (closing higher than it opened), opens within the body of the first candle and closes above it
Examples of use as a trading indicator
Similar to falling windows, where the window can be used to estimate potential resistance areas (which is voided after a close above the top of the window).
More for beginners
Check out our quick start guide to candlestick charting for more information if you are new to candlestick charting!