The Ultimate Guide to Falling Window Candlestick Patterns
Last updated: January 12, 2025
Go to Screener146 stocks recognized today in the screener
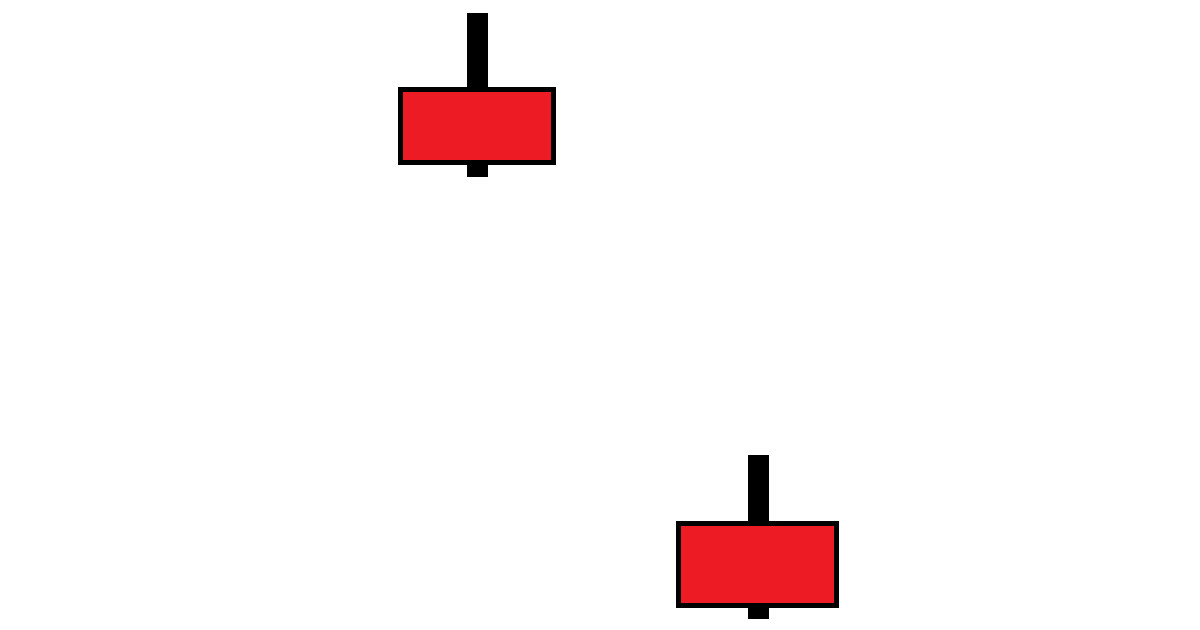
Falling Window Pattern
The falling window candlestick pattern occurs when a gap (window) forms between two consecutive candles in the chart on a price decrease from close to close:
General Identification & Interpretation
Steve Nison is credited with bringing Japanese candlestick charting to the West. In his book "Japanese Candlestick Charting Techniques" he describes falling window patterns with the following characteristics:
Typical characteristics
Gap (window) occurring between two candles (including their shadows) on a price decrease
Examples of use as a trading indicator
Can be used to estimate future support levels (at prices across the entire window), which is voided after a close above the top of the window.
Other interpretations
Also known as a "gap" in Western technical analysis
More for beginners
Check out our quick start guide to candlestick charting for more information if you are new to candlestick charting!