The Ultimate Guide to Inverted Hammer Candlestick Patterns
Last updated: January 4, 2024
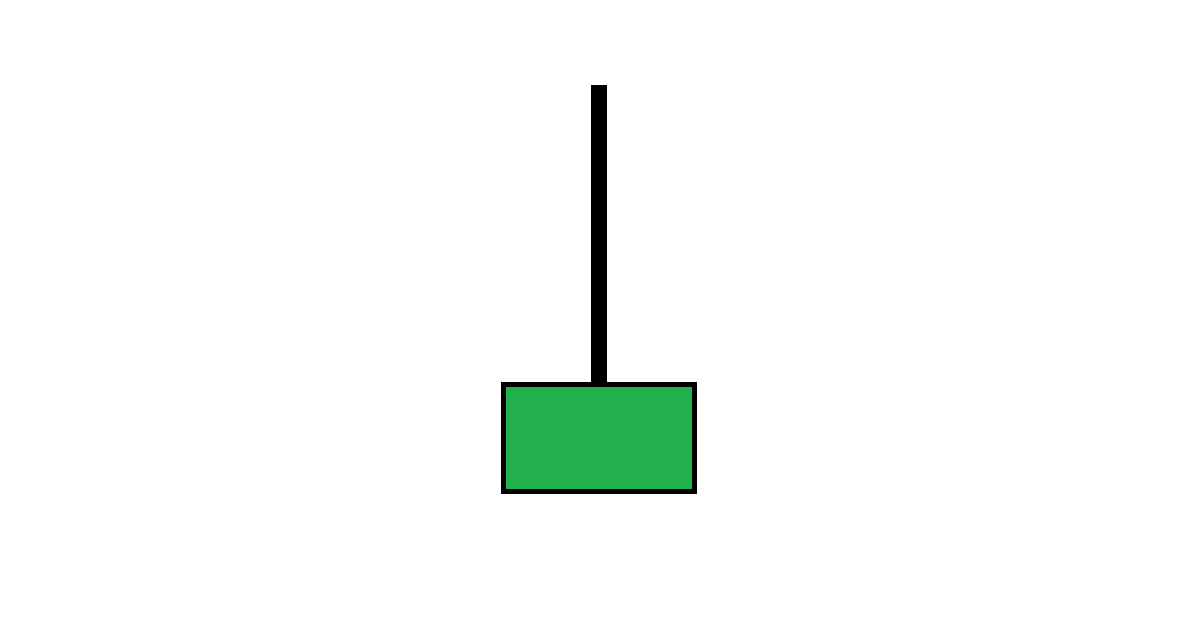
Inverted Hammer Pattern
The inverted hammer pattern can indicate a bullish reversal after a bearish run, which appears just like an upside-down hammer:
This pattern shows that the market couldn't sustain the highs seen throughout the trading day with the stock closing near the session's open.
General Identification & Interpretation
Steve Nison is credited with bringing Japanese candlestick charting to the West. In his book "Japanese Candlestick Charting Techniques" he describes inverted hammer patterns with the following characteristics:
Typical characteristics
Small candle body with longer upper shadow, resembling an upside-down hammer
Minimal (to zero) lower shadow
Upper shadow more than twice the length of the body
Examples of use as a trading indicator
Potential reversal signal
More for beginners
Check out our quick start guide to candlestick charting for more information if you are new to candlestick charting!