The Ultimate Guide to Three Buddha Top Candlestick Patterns
Last updated: January 4, 2024
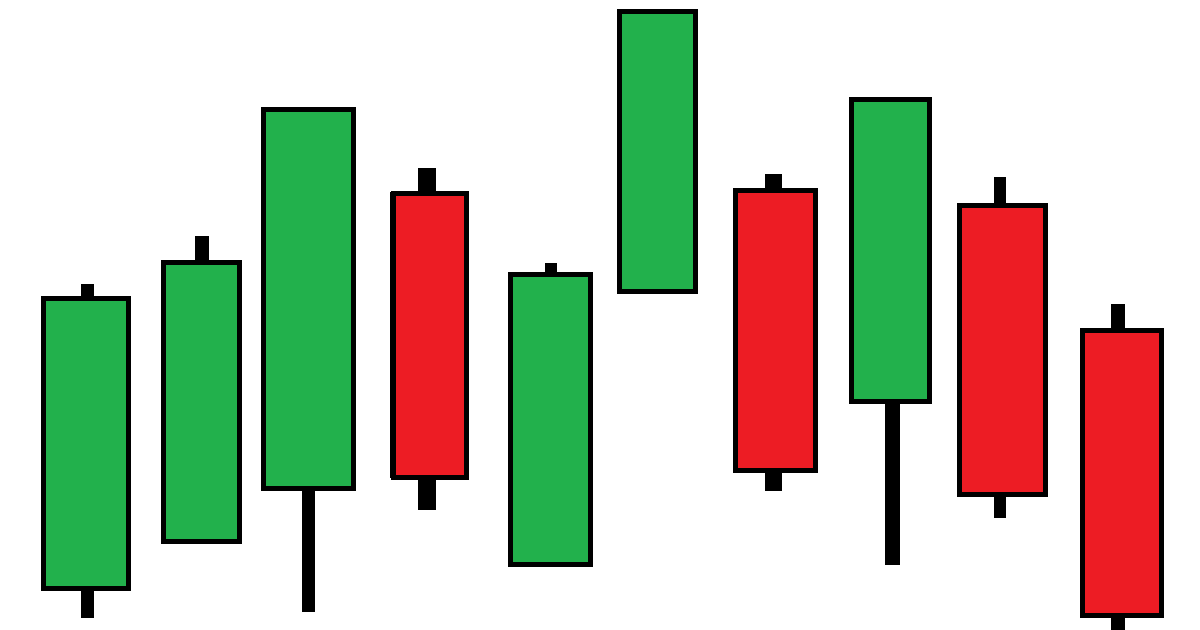
Three Buddha Top Pattern
The three Buddha top candlestick pattern occurs when a stock retreats from its highs three times, where the middle peak is larger than the first and third:
General Identification & Interpretation
Steve Nison is credited with bringing Japanese candlestick charting to the West. In his book "Japanese Candlestick Charting Techniques" he describes three Buddha top patterns with the following characteristics:
Typical characteristics
Stock backs off from its highs (or makes attempts at highs) three times, with the largest peak being the middle peak
The last high peak of the pattern should be confirmed with a bearish candle
Examples of use as a trading indicator
Represents a major top
The neckline of the head and shoulders pattern could be used as future resistance line
Other interpretations
This pattern is similar to the head and shoulders pattern
More for beginners
Check out our quick start guide to candlestick charting for more information if you are new to candlestick charting!