The Ultimate Guide to Three River Bottom Candlestick Patterns
Last updated: January 4, 2024
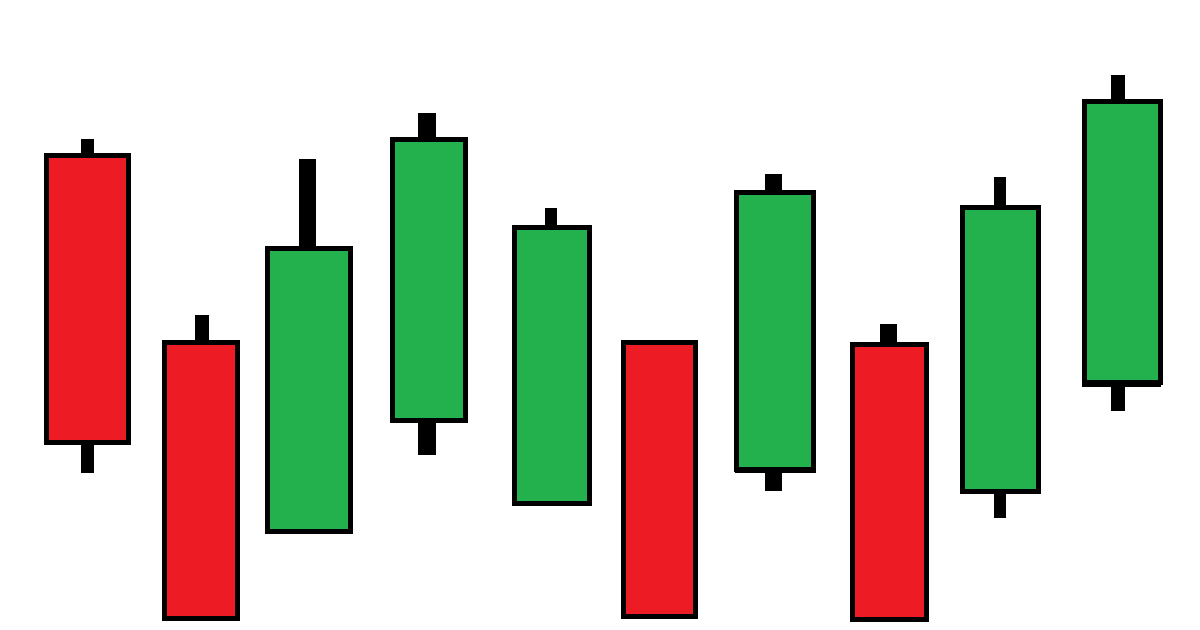
Three River Bottom Pattern
The three river bottom candlestick pattern occurs when a stock tests its lows three times and does not decline any further in price:
General Identification & Interpretation
Steve Nison is credited with bringing Japanese candlestick charting to the West. In his book "Japanese Candlestick Charting Techniques" he describes three river bottom patterns with the following characteristics:
Typical characteristics
A stock tests its lows three times
The three troughs of the pattern don't necessarily have to be at the same price
Examples of use as a trading indicator
Represents a major bottom
Other interpretations
If the middle peak in the pattern is the lowest peak, this pattern is known as an inverted three Buddha pattern
More for beginners
Check out our quick start guide to candlestick charting for more information if you are new to candlestick charting!