The Ultimate Guide to Tower Bottom Candlestick Patterns
Last updated: January 4, 2024
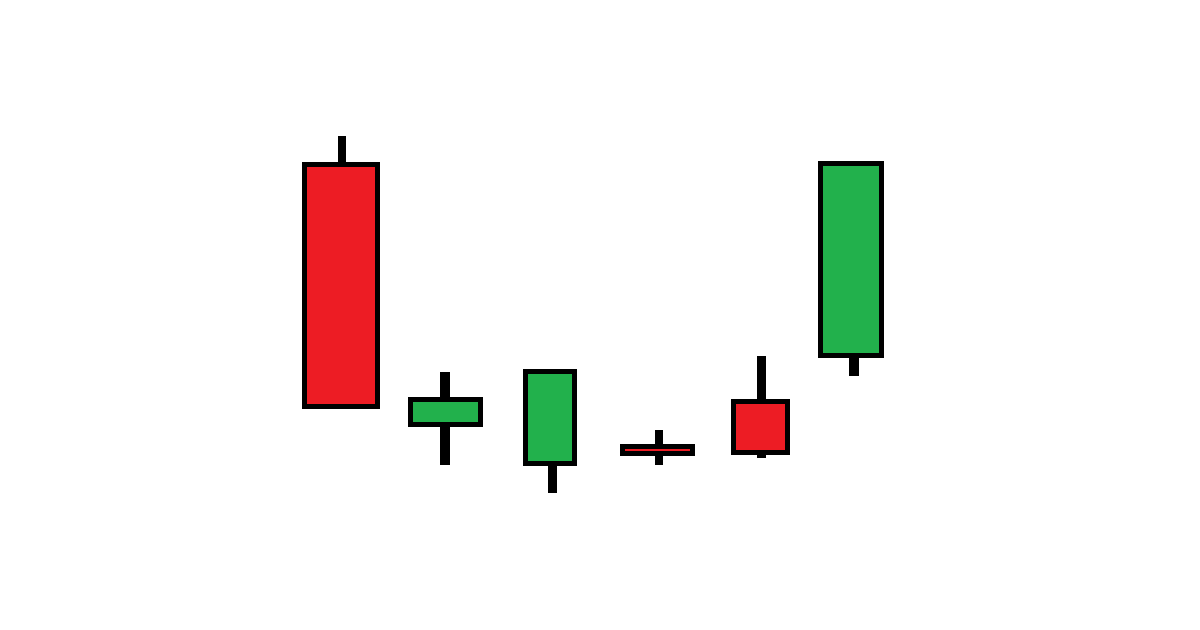
Tower Bottom Pattern
Tower candlestick patterns occur when two large real candle bodies brace the sides of multiple smaller real bodies, marking a top or a bottom in price. In a tower bottom pattern, multiple small real candlesticks are seen in between two large real candlestick bodies, marking a bottom:
General Identification & Interpretation
Steve Nison is credited with bringing Japanese candlestick charting to the West. In his book "Japanese Candlestick Charting Techniques" he describes tower bottom patterns with the following characteristics:
Typical characteristics
Two candlesticks of opposing colors with large real bodies occur on the sides of multiple other candles with small real bodies
Tower bottom candlestick patterns occur at low prices
Examples of use as a trading indicator
After completion of the pattern, the stock may have ascended or descended in price significantly so the stock may be in an overbought or oversold state after the pattern completes
Other interpretations
Similar to the spike (V) reversal in Western technical analysis.
More for beginners
Check out our quick start guide to candlestick charting for more information if you are new to candlestick charting!