The Ultimate Guide to Upside-Gap Two Crows Candlestick Patterns
Last updated: January 12, 2025
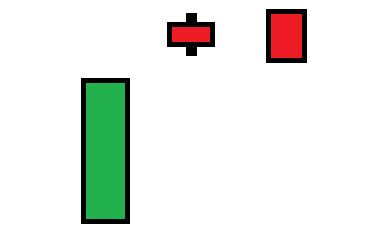
Upside-Gap Two Crows Pattern
The upside-gap two crows candlestick pattern is a series of three candlesticks, where the first candlestick is an extended green bullish candle, indicating that the bulls are in full control of the market. The following day gaps up, but the stock sells off throughout the day and results in a small red body. On the third day, the stock opens, even higher than the open on the previous day, but also sells off, to the point where the stock closes lower than it did on the previous day, engulfing it. This pattern can signal potentially additional bearish activity ahead for the stock:
General Identification & Interpretation
Steve Nison is credited with bringing Japanese candlestick charting to the West. In his book "Japanese Candlestick Charting Techniques" he describes upside-gap two crows patterns with the following characteristics:
Typical characteristics
First candle is a long extended green candle
Second candle gaps up, but ends up having a small real body as the stock sells off (red) and closes lower than it opened
Third candle opens higher than the previous candle, and also sells off throughout the day (red), closing lower than the previous candle closed
Examples of use as a trading indicator
Bearish indicator as the bulls, who had full control of the market on the first day of this pattern, seemingly lose dominance to the bears
After this pattern occurs, the subsequent candle can be used as a confirmation of the bearish move
More for beginners
Check out our quick start guide to candlestick charting for more information if you are new to candlestick charting!